SubcellulaRVis is a tool for visualising enrichment of Gene Ontology Cellular Compartments within gene lists
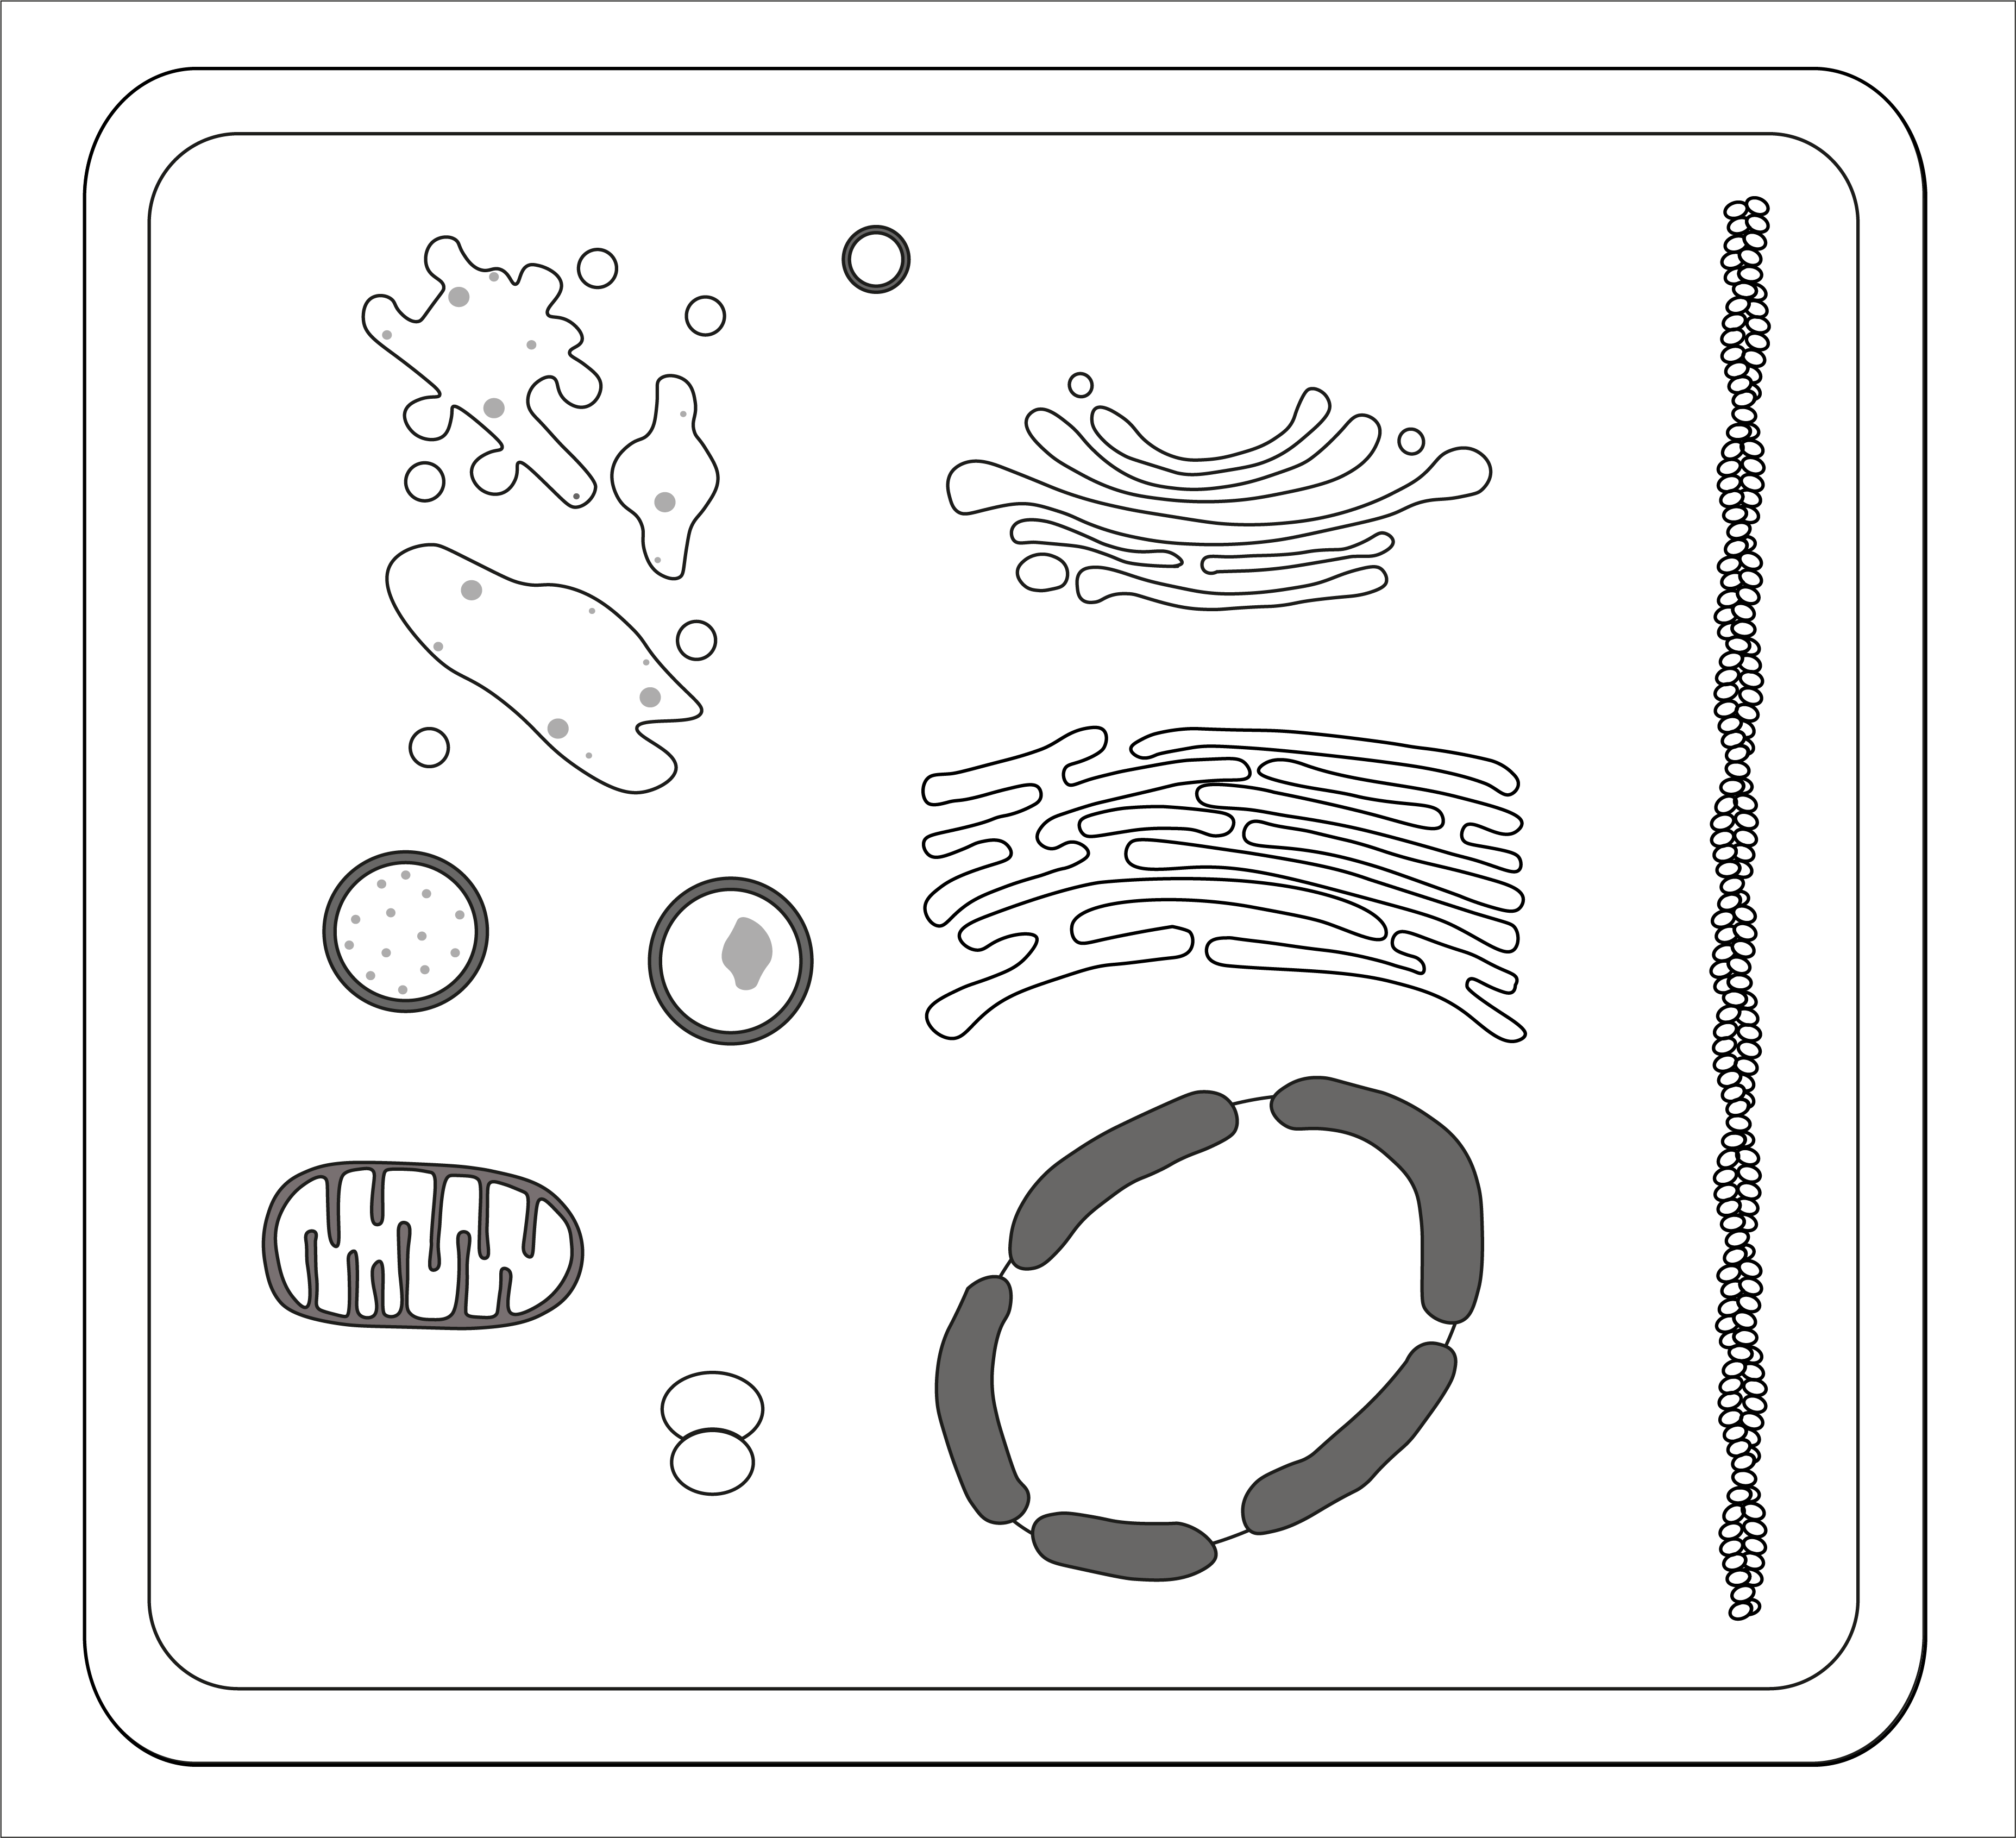
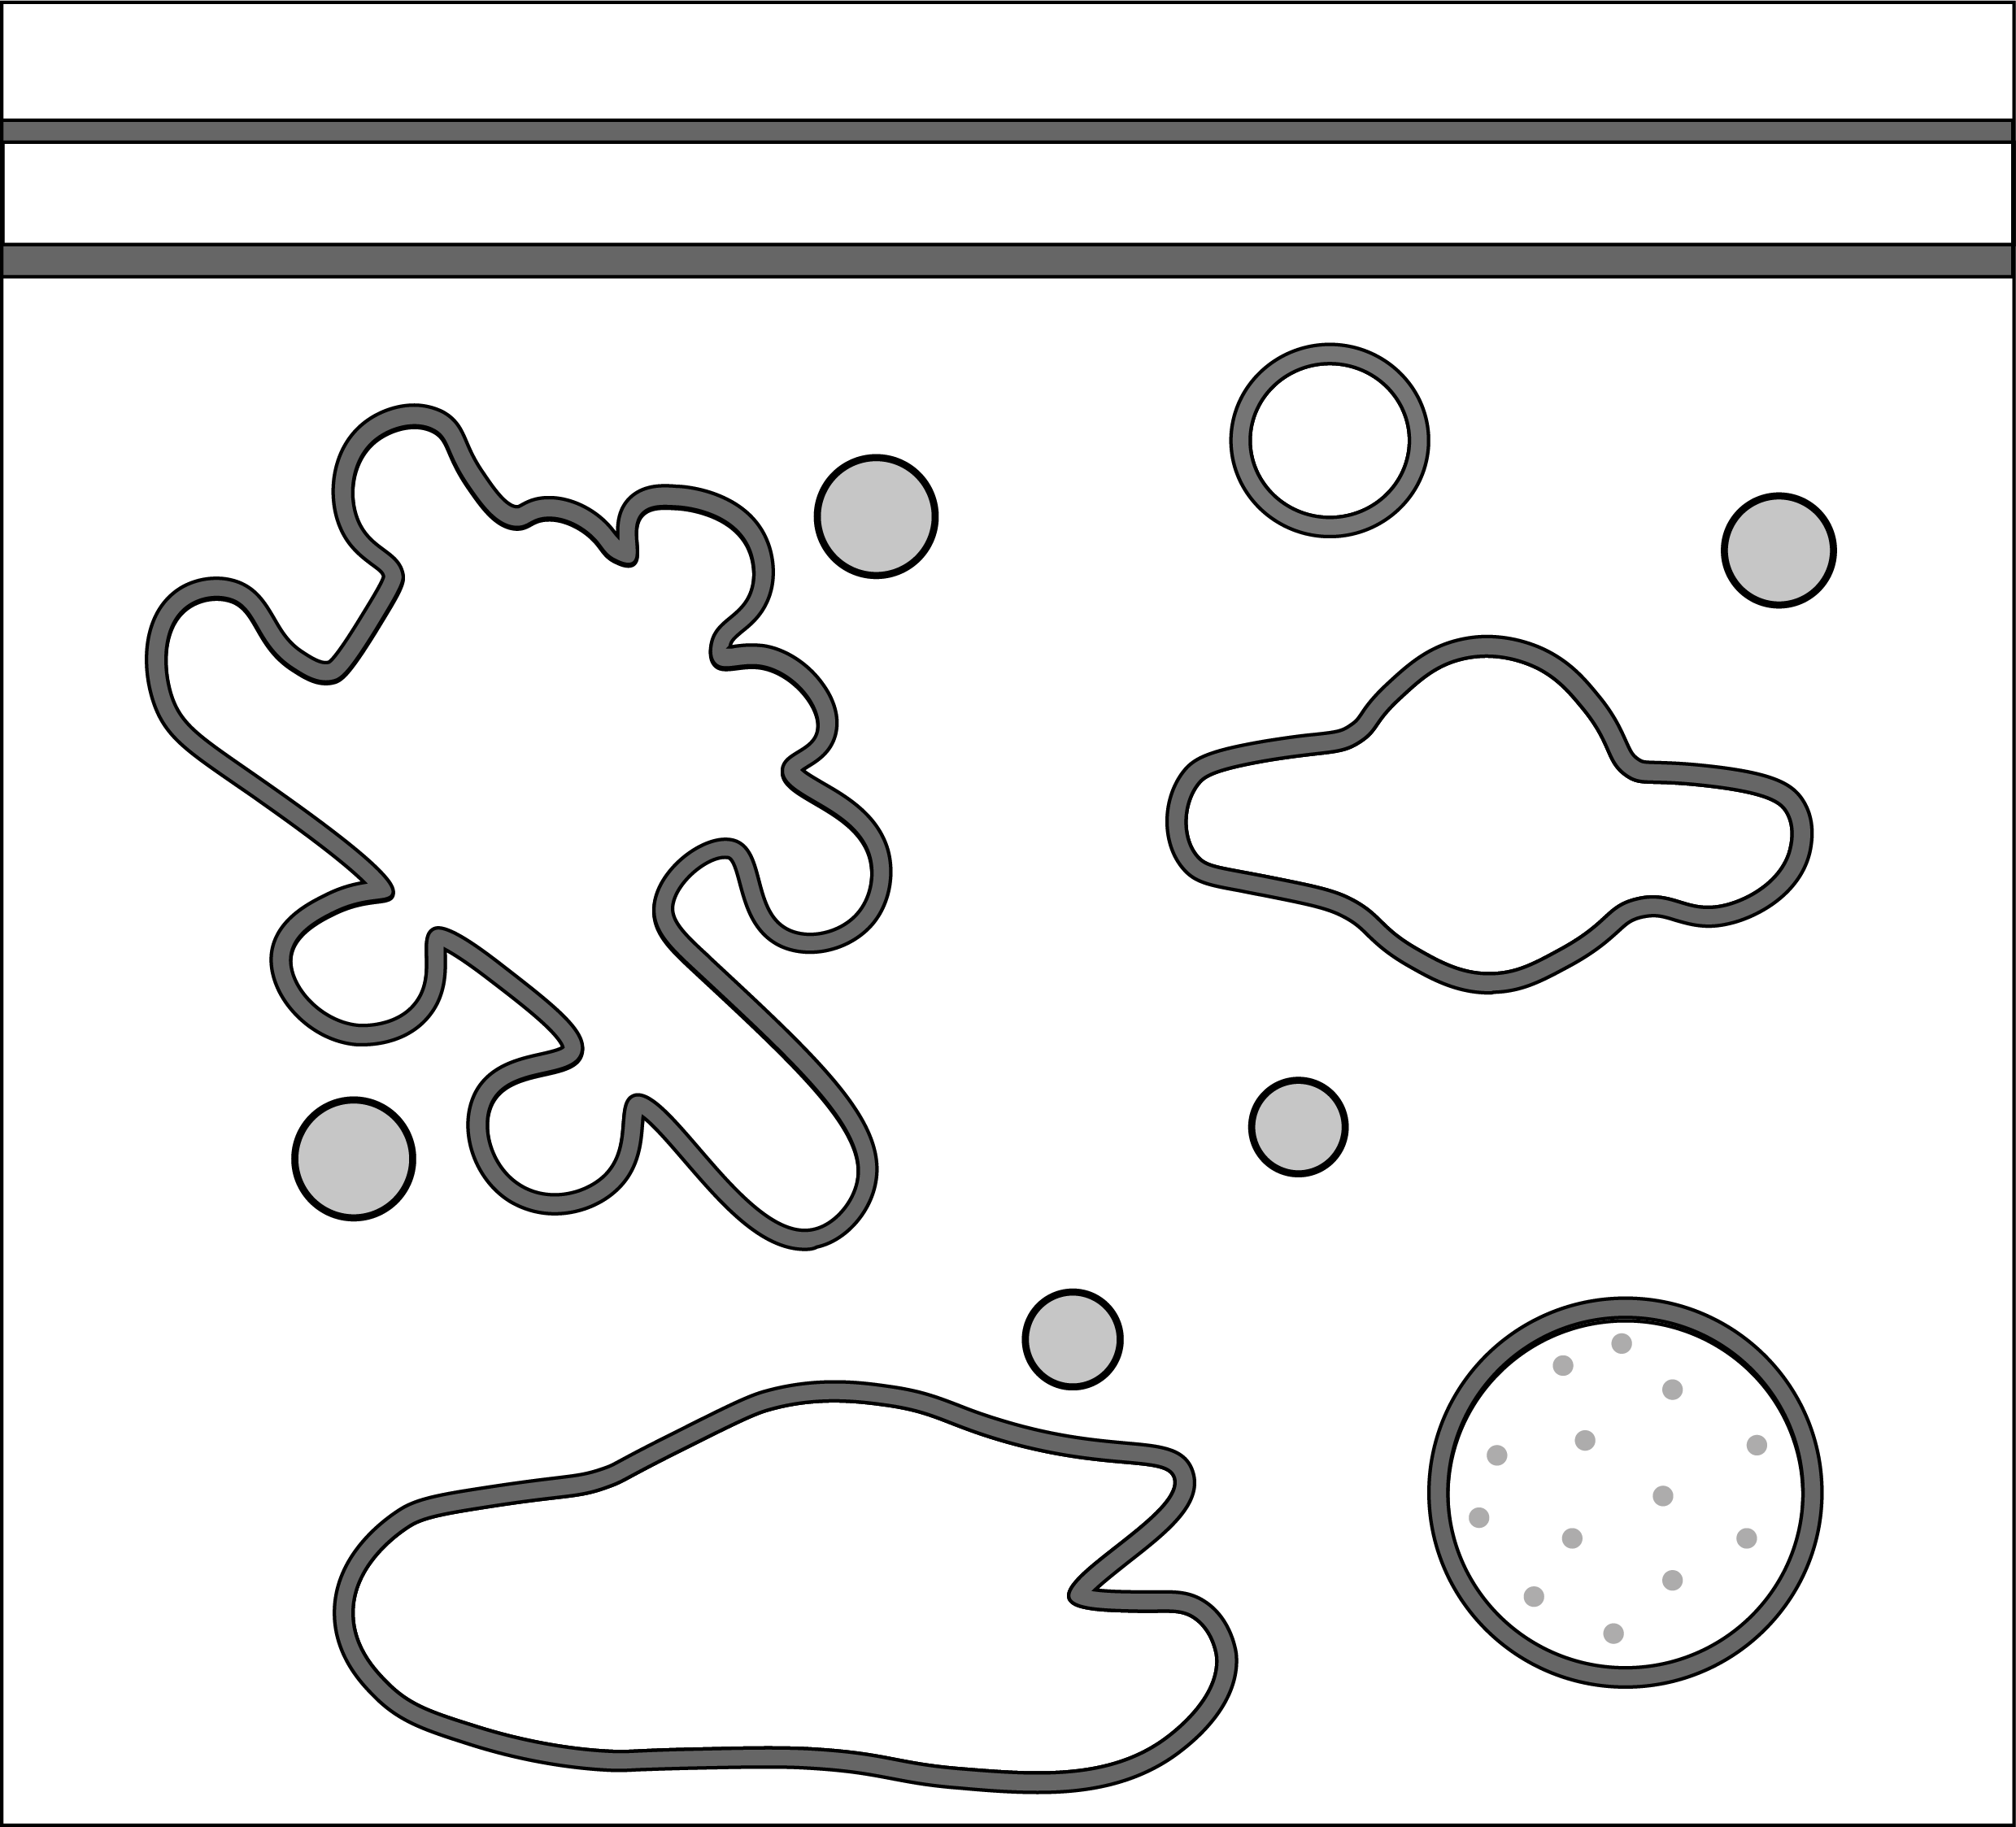
Input your gene or protein list as a text or .csv input in the box to the left. Make sure to select the correct organism and gene/protein identifier type. You can calculate enrichment based on the whole cell (left above) or the endosomal system (right above)
Source code for this app can be found at: www.github.com/jowatson2011/subcellularvisSupported by:
Note: This enrichment is performed using GO annotations, even if Human Protein Atlas has been selected.
View our publication describing SubcellulaRVis:
https://doi.org/10.1093/nar/gkac336How does SubCellulaRVis work?
SubCellulaRVis calculates the enrichment of proteins for cellular compartments, inferred from the Gene Ontology Cellular Compartment aspect. The broad categories of organelles and compartments were drawn from the Gene Ontology Cellular Compartments (GOCC). Using the GO hierachy, all 'child' terms of these categories are grouped together to calculate a single enrichment score for each category. We can then visualise this in a single graphic.
How is the gene list processed?
Duplicated genes are removed, and identifiers are then mapped to their annotations in the Gene Ontology or Human Protein Atlas, as specified. The number of successfully mapped genes and a list of unmapped genes can be found at the top of the 'Table' and 'Full Enrichment' tabs
How do I map my gene list to HGNC symbols or Uniprot ID?
The BioMart service (https://m.ensembl.org/biomart/martview/) can be used to map identifiers. Full instructions can be found on the Ensembl website (https://m.ensembl.org/info/data/biomart/index.html).
What is the background population?
The "background population" is the total population of expressed proteins in the sampled (e.g. proteome size for a cell type or species). The default background is the genes in the reference genomes.
What is the difference between the simple and full enrichment?
The simple enrichment is based on the categorisation as described above. The full enrichment is a standard enrichment analysis based on all the GOCC terms.
How do I interpret the results?
SubcellulaRVis provides a simplified version of Gene Ontology Cellular Compartment (GOCC) enrichment results. Enrichment analyses are based on over-representation of proteins or genes annotated to annotations such as GOCC terms. SubcellulaRvis projects these results onto a schematic of the cell (or subcellular system). The compartments are representative of a set of GOCC terms that describe that compartment; enrichment for that compartments suggests enrichment in your gene list of some in that set of terms. The full set of GOCC terms can be found in the 'Full Enrichment' tab.
How can I export my results?
The visualisation can be exported in multiple image formats from the "Plot" tab. Enrichment results can be exported as a .csv file from the "Full Enrichment" tab. A log of the analysis can be exported as a .doc file from the "Table" tab
Can I run SubcellulaRVis locally or programmatically?
An R package for SubcellulaRVis can be used for both of these purposes. The package is simple to use and can be downloaded from GitHub, where details on how to use the package can be found: https://github.com/JoWatson2011/subcellularvis.
If you could not find your answer here, please contact: joanne.watson@manchester.ac.uk or raise an issue on the GitHub repository:
www.github.com/jowatson2011/subcellularvis